At the time of writing, Democrat presidential candidate Joe Biden leads the polls by 10 percentage points and will likely be elected President of The United States on 3 November 2020. The potential for a Democrat “Blue Wave” with control of both houses easing the passage of legislation also seems possible.
Change is in the air
The Democratic Party and candidate Joe Biden acknowledge climate change and accept the scientific evidence that human generation of greenhouse gases has resulted in excess global warming.
The US did not stand still while President Trump withdrew from the US commitment to the Paris Climate Accord. A pushback movement of dozens of states and cities led by California made pledges to honour Paris carbon reduction commitments without Washington signing.
California has been progressive on many fronts, not least their resolve, actions and success in the transition to clean energy. For example, they fought to retain higher-than-Federal vehicle fuel efficiencies and established a position as global leader with their renewable transport fuel initiative—the Low Carbon Fuel Standard (LCFS).
he overarching Biden climate election pledge is a plan to re-join the Paris Climate Accord and lead the world by example and to ensure the U.S. achieves a 100% clean energy economy and reaches net-zero emissions no later than 2050.
The necessary energy transition to reduce carbon emissions by greater efficiency and shifting to clean energy sources is a massive challenge. Intermittency of existing renewable energy sources of wind and solar require scale storage solutions that do not currently exist. Nuclear is a carbon silver bullet, but operating risks and lifecycle issues arise when it comes to storage of spent fuel.
The coincidence of the election cycle with the COVID-19 economic crisis, coupled with meeting the energy transition challenge, means candidate Biden has proposed a green stimulus package of USD 1.7 trillion over the next ten years. Under his proposal, clean energy will be funded by rolling back the Trump presidency corporate tax cuts from 21% to 28%, removing all incentives to fossil fuel companies and implementing polluter-pays enforcement mechanisms.
Green infrastructure stimulus meet the dual needs of economic stimulus to counter the COVID-19 economic downturn and accelerate the transition to clean energy.
The economic stimulus appeal is due to the scale and new asset nature of the projects. International Monetary Fund (IMF) studies of prior GFC stimulus programs found that green infrastructure programs have a greater impact on job creation and a higher economic multiplier (3 – 4 times) versus traditional infrastructure multiplier of 1.7 times. The same studies found that the multiplier of fiscal stimulus from tax cuts was only 0.7 times due to some consumers saving rather than spending the tax cut.
There is no specific cost breakdown for the USD 1.7tn for the campaign list of clean energy initiatives other than $400 billion for climate and energy research and development—presented as a modern day “Moonshot” valued at twice the Apollo program in todays’ dollars.
The scale is approximately the same as the European programs announced this year, including the EU Green Deal USD 1.2tn announced in January and subsequent Next Generation USD 600b announced in May. Both had similar objectives of higher multiplier fiscal stimulus against COVID-19 and progressing the Green Agenda.
The year one legislative agenda put forward by the Biden campaign is blanketed as “US sourced” and includes:
- a 50% reduction of the carbon footprint of the building stock by 2035 via incentivised retrofits
- the acceleration of locally made vehicle fleet conversion to electric vehicles (EV) via government procurement policies
- consumer incentives, such as cash for clunkers
- a rollout of 500,000 EV charge stations by 2030
- smart-grid upgrades.
The day one agenda items list methane pollution limits, higher fuel efficiency for transport and a “doubling-down on liquid fuels of the future”.
The Biden-Sanders Unity Task Force recommendations on climate change, included the following statement:
“We will immediately convene California and other states with labor, auto industry, and environmental leaders to inform ambitious executive actions that will enable the United States to lead the way in building a clean, 21st-century transportation system and stronger domestic manufacturing base powered by accessible, high-wage, union jobs.”
—Combating the Climate Crisis and Pursuing Environmental Justice, 8 July, 2020
Recognition of California’s leadership and policy success in stimulating private sector investment in advanced biofuel plants under the existing LCFS is a window into the likely programs to be implemented under a new government.
The transport sector has a significant part to play in reducing greenhouse gases. The California Air Resources Board (CARB) cites that the sector is responsible for 50% of GHG emissions (including industrial sector emissions from refining and crude production), 80% of ozone-forming gas emissions, and over 95% of diesel particulate matter. The need for clean transport fuels is clear.
What are the policy objectives of LCFS?
The initial LCFS target was to reduce the carbon intensity (CI) of transportation fuel used in California by 10% by 2020 from a 2010 baseline. This has since been extended to a 20% reduction by 2030. Additional benefits expected include diversification of fuel pool, reduction in petroleum dependency and a reduction in noxious emissions in addition to carbon.
Why is LCFS better than past renewable schemes?
In contrast to an earlier Renewable Fuel Scheme (RFS), which mandated ethanol, the LCFS lets the market determine which mix of fuels will be used to reach the program targets. LCFS credits are generated for exceeding the target reduction and deficits incurred for falling short. The deficits can be met through the trading of credits subject to a price cap.
In addition to the clean fuel production pathway, credits can be generated via carbon abatement and capture projects as well as EV charging capacity. In doing so, this helps align the interests of the electricity utilities and automobile industry (which induce EV sales with subsidies) and incentivises existing refiners to invest in renewable fuel projects.
The earlier RFS did not consider the full lifecycle greenhouse gas emissions and corn-based ethanol was criticised widely and notably discredited by environmental group the Sierra Club. The land use change triggered by the corn incentive carried significant alternative food crop opportunity cost. Refineries didn’t like it as it added agricultural volatility and complexity to storage and distribution. Ethanol blended fuels have restrictions on blend percentage due to corrosion of fuel systems.
What are the outcomes of LCFS?
Since implementation in 2011 to the last reported figure in 2019, the carbon intensity of transportation fuel consumed in California has declined 6%.
Chart 1 – Reduction in carbon intensity
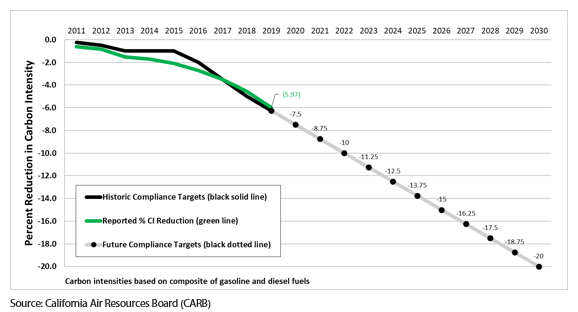
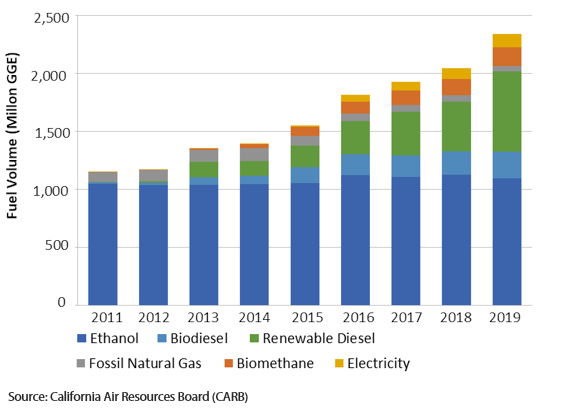
The 2010 benchmark carbon intensities for gasoline and diesel were both 100g/MJ and remain so today. Carbon intensity reduction is achieved through the blending with lower CI fuels. The total amount of renewable fuel produced to meet the targets and composition is shown in Chart 2.
The largest contribution to the increase in renewable fuels has come from biodiesel. The reason that renewable diesel reflects the greater value in renewable is due to higher blending capacity as well as lower carbon intensity. By example, corn ethanol has CI of 58g/MJ whilst renewable diesel has 33g/MJ. In regard to blending, renewable diesel can fully substitute fossil diesel without limits due to storage life, operating temperature or corrosion of fuel systems.
Chart 2 – Renewal fuel targets and composition
Washington State, Oregon and British Columbia have implemented similar schemes and together with California, formed the Pacific Coast Collaborative.
The scheme looks well established, functioning with sufficient incentives to achieve the primary objective. Irrespective of the US election outcome and COVID-19 downturn in energy demand, investment in renewables is continuing in the US.
In August, energy company Phillips 66 announced plans to reconfigure its San Francisco Refinery in Rodeo, California, to produce renewable fuels. The plant would no longer produce fuels from crude oil, but instead would make fuels from used cooking oil, fats, greases and soybean oils. Combined with the production of renewable fuels from an existing project in development, the plant would produce greater than 800 million gallons a year of renewable fuels, making it the world’s largest facility of its kind.
Why is the change in US party leadership relevant to our investment process?
Europe, China, Japan, South Korea and potentially the US (with a Biden win) will be heading in the same green direction building momentum in the reduction of carbon.
A Democrat Biden presidency will change supply side economics for fossil fuels in the US and the world. Removal of existing subsidies and imposition of methane caps, and capital cost to capture or polluter-pays penalties will raise costs and reduce supply at a point when demand for fossil fuel has been reduced due to the economic impacts of COVID-19.
Rationalised energy supply and higher cost could see energy prices higher as they have a carbon price implicitly embedded. This could have consequences for inflation and inflation expectations at time of increased supply of debt issuance to fund stimulus programs. Interest rates could rise as a consequence of the Biden policies and serve as a catalyst for a rotation in sector leadership, favouring discounted value sectors such as financials and materials over expensive growth and defensive sectors.
Incentivised reduction in the passenger vehicle fleet age and upgrade to higher fuel efficiency and EV penetration is supportive of automakers and their supply chains. Flat steel, steel re-cycling and copper producers would be beneficiaries.
Reduction in building carbon footprint through retro-fitting incentives will be labour intensive and drive job creation as well as boosting demand in materials sectors.
Australia is the largest exporter of liquefied natural gas (LNG), which, including coal, accounts for 25% of the value of Australian exports. The terms-of-trade are exposed to taking a different stance on carbon vs approximately half of trading partners.
The strongest counter argument to these downside risks to trade and the Australian dollar rests on LNG having a relatively low carbon intensity of 54g/MJ and therefore justifiable longevity as a transition fuel.
In contrast to the longer term green infrastructure initiatives of the major economies, the most recent Australian Federal budget committed to personal tax cuts, which may be saved rather than be translated into consumption and short-term incentives for small business to spend. The economic effectiveness of this will, in all likelihood, be less potent.
Irrespective of government initiatives, customer expectations have had an increasing influence on corporate behaviour. For example, banks announcing restrictions on lending to coal companies will influence funding costs and commitments more generally by companies to reduce their carbon footprint through the use of renewable energy.
Our active valuation based investment process embeds awareness of these growing policy trends and future events, which are recognised in future earnings, funding costs, risks and asset valuations that ultimately determine allocation of portfolio capital.
Important Information
This material was prepared and is issued by Nikko AM Limited ABN 99 003 376 252 AFSL No: 237563 (Nikko AM Australia). Nikko AM Australia is part of the Nikko AM Group. The information contained in this material is of a general nature only and does not constitute personal advice, nor does it constitute an offer of any financial product. It does not take into account the objectives, financial situation or needs of any individual. For this reason, you should, before acting on this material, consider the appropriateness of the material, having regard to your objectives, financial situation and needs. The information in this material has been prepared from what is considered to be reliable information, but the accuracy and integrity of the information is not guaranteed. Figures, charts, opinions and other data, including statistics, in this material are current as at the date of publication, unless stated otherwise. The graphs and figures contained in this material include either past or backdated data, and make no promise of future investment returns. Past performance is not an indicator of future performance. Any economic or market forecasts are not guaranteed. Any references to particular securities or sectors are for illustrative purposes only and are as at the date of publication of this material. This is not a recommendation in relation to any named securities or sectors and no warranty or guarantee is provided.