Snapshot
Inflation uncertainty seems increasingly entrenched, which is less kind to US Treasuries (USTs) and other developed market (DM) sovereign bonds in general. The US fiscal deficit is very large, and the Federal Reserve (Fed) is now in the challenging position of deciding when to cut rates as inflation pressures could well be on the rise instead of in a continued decline. As activity gathers pace, energy remains a good hedge in this environment, and gold is increasingly being recognised as a store of value.
Determining the macro fundamentals that confirm an ongoing regime shift is not easy, which is why we rely on statistical models. These models take into account the natural fluctuations of asset class volatility and correlations over time. Indeed, gold now appears the safer asset compared to DM duration. This is because both volatility and correlations to equity risk are higher for DM duration relative to gold. Interestingly, our models also show emerging market (EM) local currency sovereigns as safer assets than just a couple of years ago. Are high real yields, resulting from orthodox policy and sustainable debt loads, starting to be noticed for their relative safety?
We maintain a constructive outlook for improving growth conditions, taking into account fiscal support, strong immigration, increased investment and an upturn in the manufacturing cycle. While the growth outlook appears quite rosy, we do acknowledge elements that may not be fully sustainable—such as the degree of fiscal spending in the US. Fortunately, from a risk perspective, our models are guiding our portfolios to a defensive posture, enabling them to benefit from growth while being hedged against inflation risk.
Cross-asset1
We maintained a significant overweight to growth, while keeping a neutral position on defensives. Global demand still appears well-supported, thanks to ongoing US fiscal support, an increase in global immigration and an upturn in the global manufacturing cycle. Interestingly, higher rates seem to be less of an issue in a total demand context, as they have not yet stifled liquidity where spending by governments remains unrestrained. This dynamic not only supports growth assets, but also defensive assets like gold. The attractiveness of bonds may diminish due to high issuance and inflation likely settling above the Fed’s 2% target.
We did not change the cross-asset scores within growth, continuing to rank DM and commodity-linked equities highest due to their combination of growth and inflation hedge characteristics. We maintain a smaller overweight to EM but have significant underweights to infrastructure and REITs. This is due to their yields being less attractive compared to current growth opportunities, and their sensitivity to potential increases in rates.
Within defensives, we lifted gold back to overweight after reducing it to neutral the previous month. The decision was based on a re-evaluation of gold’s protective characteristics versus duration, which we believe will maintain its durability in the coming months and potentially years. We funded this lift with small reductions from investment-grade (IG) credit and DM sovereigns, where spreads and yields are less attractive.
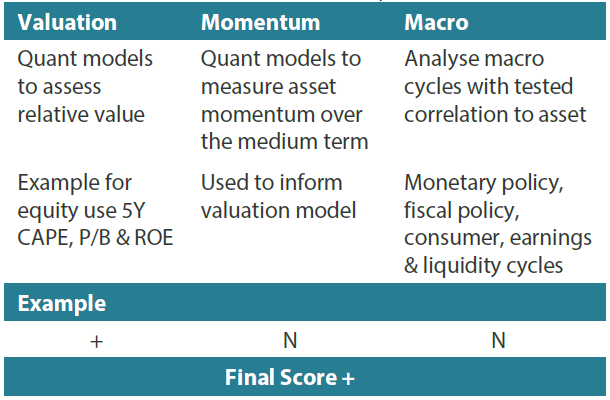
1 The Multi Asset team’s cross-asset views are expressed at three different levels: (1) growth versus defensive, (2) cross asset within growth and defensive assets, and (3) relative asset views within each asset class. These levels describe our research and intuition that asset classes behave similarly or disparately in predictable ways, such that cross-asset scoring makes sense and ultimately leads to more deliberate and robust portfolio construction.
Asset Class Hierarchy (Team View2)
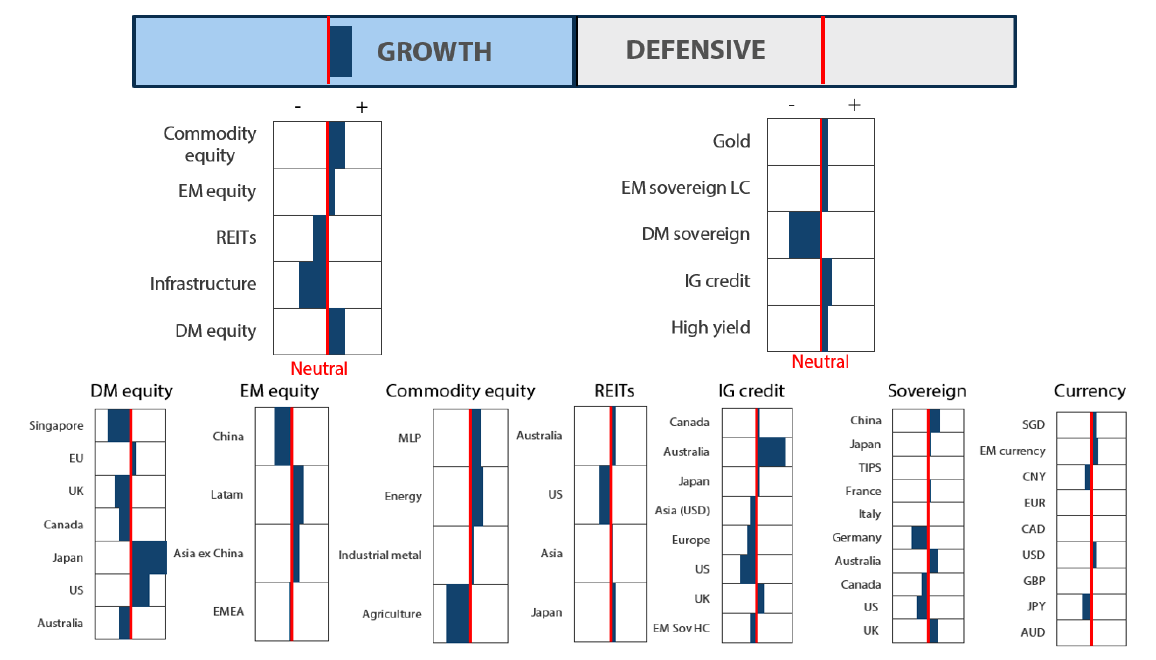
2The asset classes or sectors mentioned herein are a reflection of the portfolio manager’s current view of the investment strategies taken on behalf of the portfolio managed. The research framework is divided into 3 levels of analysis. The scores presented reflect the team’s view of each asset relative to others in its asset class. Scores within each asset class will average to neutral, with the exception of Commodity. These comments should not be constituted as an investment research or recommendation advice. Any prediction, projection or forecast on sectors, the economy and/or the market trends is not necessarily indicative of their future state or likely performances.
Research views
Growth assets
Growth assets accelerated into March, reflecting widespread support across a range of geographies and sectors tied to the real economy. As highlighted last month, the end of negative rates turned out to be beneficial for Europe and Japan. In both regions, banks have become the best performing sector so far this year.
In Europe, the bank sector is led by Italian and Spanish institutions. Coincidentally, they were the weakest banks just over a decade ago. This was after then European Central Bank chief Mario Draghi promised to do “whatever it takes”, including implementing quantitative easing (QE) and negative rates. These measures were partly intended to give banks time to repair their balance sheets.
Indeed, bank balance sheets in both in Europe and Japan have been strengthened, and the sector is generating strong profits on the back of higher bond yields since late 2020. We believe that rates may stay “higher for longer” as inflation is likely to persist; in general, owning bank stocks and financial equities seems sensible as they continue to benefit from a higher rates environment.
A broadening recovery through the lens of bank stocks
Bank stocks are a reliable measure of growth fundamentals. Last month, we observed the European and Japanese equity markets faring much better than expected on prospects of positive rates. Every robust equity market typically requires a banking system in good condition, as healthy banks support real economic growth, which in turn is supportive of the broad market.
European and Japanese banks, which had underperformed the broad market since the Global Financial Crisis (GFC), finally found better earnings support with higher bond yields towards the end of 2020. Japanese banks have significantly outperformed the broad market, while European banks also appear to be gaining momentum.
Chart 1: European and Japanese banks’ performance vs. broad market
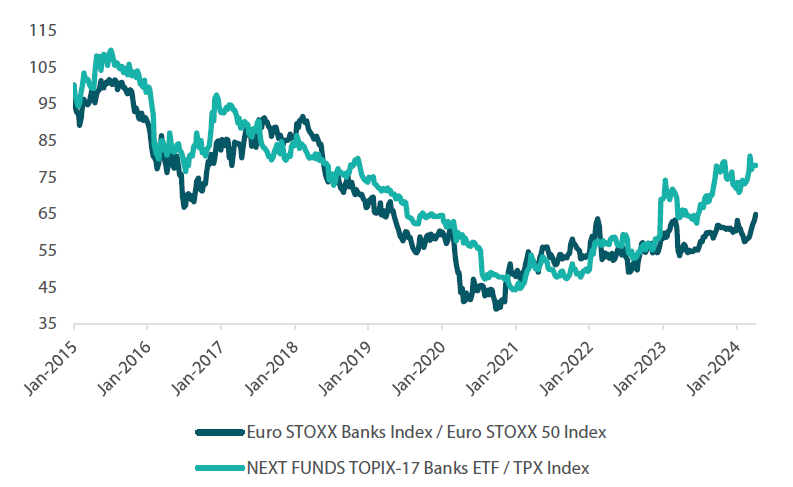
Source: Bloomberg, April 2024
Looking a little closer, bank balance sheets have been in repair since the GFC, and non-performing loans have been reduced significantly. However, even with improved balance sheets, low/negative interest rates were not conducive to profits as negative rates had an unfavourable impact on net interest margins (NIMs). Starting in late 2020, banks found relief in the form of rising bond yields, which improved banks’ NIMs in both in Europe and Japan. Chart 2 below illustrates this direct linkage between higher bond yields (German 10-year yield) and the NIM for Union Credit, Italy’s largest bank. A similar story is seen with Japan banks, although the phenomenon has been less pronounced due to the relatively smaller rise in the 10-year Japanese government bond yield, which has climbed from roughly -25 basis points (bps) to above 80 bps.
Chart 2: Union Credit’s net interest margin vs. German 10-year yield
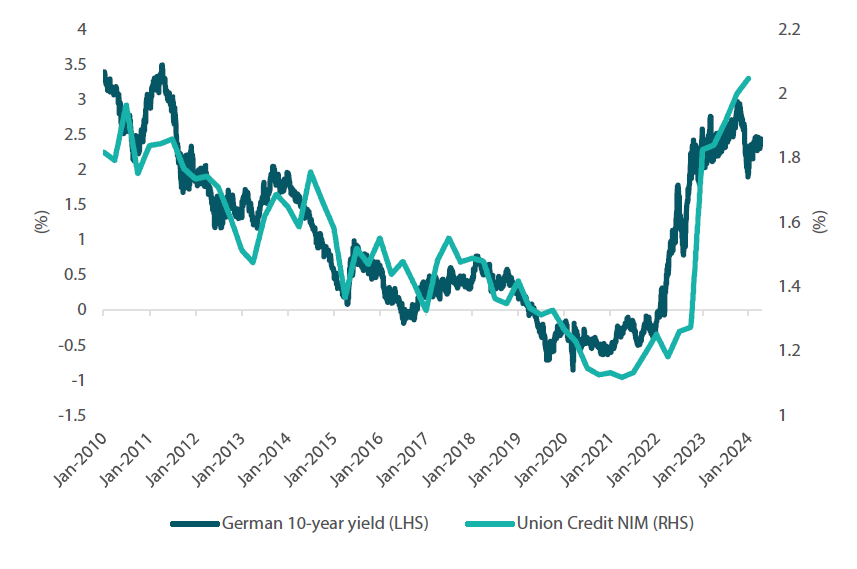
Source: Bloomberg, April 2024
So far, banks have increased their profits. However, this dynamic is yet to bolster loan growth, which is mostly a result of weak loan demand from the private sector that has been prevalent since the GFC. This can be partly attributed to demographics, as an aging society is more inclined to repay debt than to take on more.
This is where governments are stepping in to fill the gap left by the private sector through a substantial expansion of public sector debt. Even so, banks and financials appear to offer decent exposure to the real economy, with a natural hedge against rates staying higher for longer.
Our view is that rates and inflation could remain above expectations, while bank and financial stocks could stay resilient considering the supportive impact higher for longer rates are likely to have on their profits.
Conviction views on growth assets
-
Commodity-linked equities: The asset class can remain durable in an environment of higher inflation and rates, thanks to strong cash flow and increasingly resilient price support with still limited production capacity.
-
Japanese equities: This continues to be a favourite regional allocation due to Japan’s structural reforms that are progressing as expected. This means that the market can continue to appreciate on the back of improving profitability.
-
US secular growth: Although the pace of the rally in tech-related stocks slowed in comparison to the strong surge in cyclicals throughout March, we still appreciate the strong growth opportunity in tech-related investment and artificial intelligence.
-
Overweight to Europe: We believe Europe provides balance in a portfolio context, offering value and cyclical growth opportunities at still attractive valuations.
Defensive assets
Changes within defensive assets were relatively small this month, with some adjustments made for IG credit and DM sovereigns to finance the increase in gold. Exposures were reduced across the US, Europe and Asia, with a focus on reducing markets where bond yields are the most inverted and credit spreads are relatively tight. Inflation is showing signs of being more persistent than expected, and the US employment market remains robust. We therefore continue to see a risk that the Fed may not be able to deliver the amount of interest rate cuts that the market is anticipating. As with last month, we take another look at the defensive role of gold.
Gold revisited
After commenting on gold in last month’s Balancing Act, the precious metal delivered another strong rally in March, gaining more than 9% to US dollar (USD) 2,229 per ounce. As described last month, gold has been rallying even as real yields have risen, which historically would have been negative for the commodity. However, in the aftermath of the COVID-19 crisis, real rates are having a less significant impact on the long-term price of gold. Signs are beginning to emerge that the monetary excess of the past three years may be starting to affect gold.
This trend is apparent when comparing gold to USTs. The market is beginning to question whether the Fed will be able to cut interest rates as much as initially anticipated, with inflation proving to be stickier than the market expected and the unemployment rate consistently below 4% . Unfortunately for the US government, this may put into question the solvency of their budget, as the government’s net interest bill is set to reach USD 1 trillion in 2026, and the deficit expands at a blistering pace of over 6% of GDP.
Why this is important for gold becomes apparent when considering the effect of large deficits on its price. Despite the fact that US government finances have been in a particularly poor state since the GFC, running a deficit exceeding 5% is a rare occurrence. As chart 3 below shows, the government has only maintained a consistent deficit of over 5% twice since 1990, as the budget is typically repaired quickly. The price of gold rose surged significantly over these periods, and the current situation is no exception. Considering the high level of government debt and spending reaching potentially unsustainable levels, we believe the current environment will continue to favour defensive assets that cannot be debased, such as gold.
Chart 3: Gold price vs. US deficit > 5%
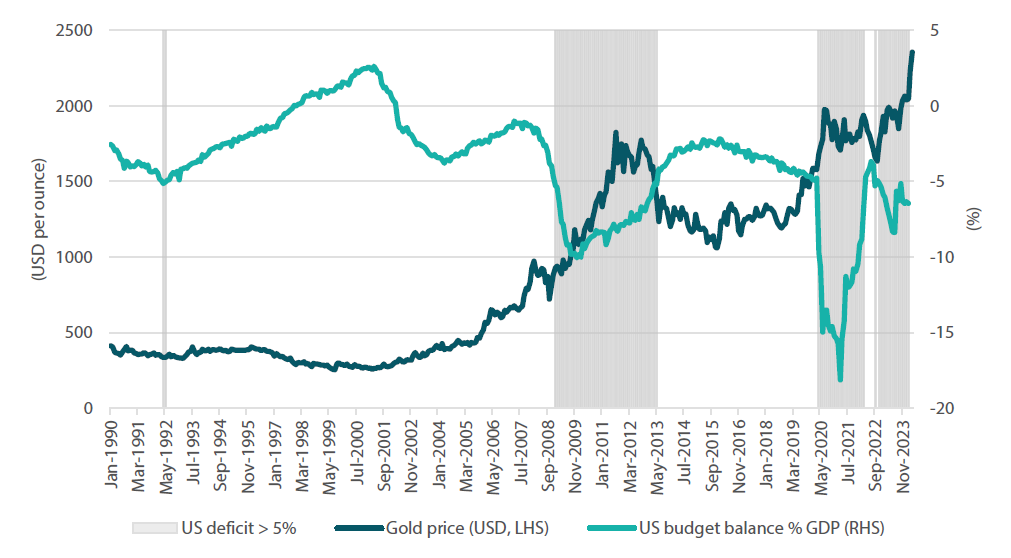
Source: Bloomberg, April 2024
To further explore this concept, it is worth considering the performance of gold relative to the outstanding monetary base. Gold enthusiasts often cite the ratio of the price of an ounce of gold versus the outstanding US money supply. Chart 4 shows that while gold has spiked over the past three months, this increase has been relatively modest when compared to the monetary expansion witnessed over the past three years. Unlike in 2009, when the price of gold rose far faster than the money supply, the current expansion does not look overvalued. Rather, it shows that when compared to the money supply, we are only at the long-term average.
Chart 4: Gold price vs. US money supply
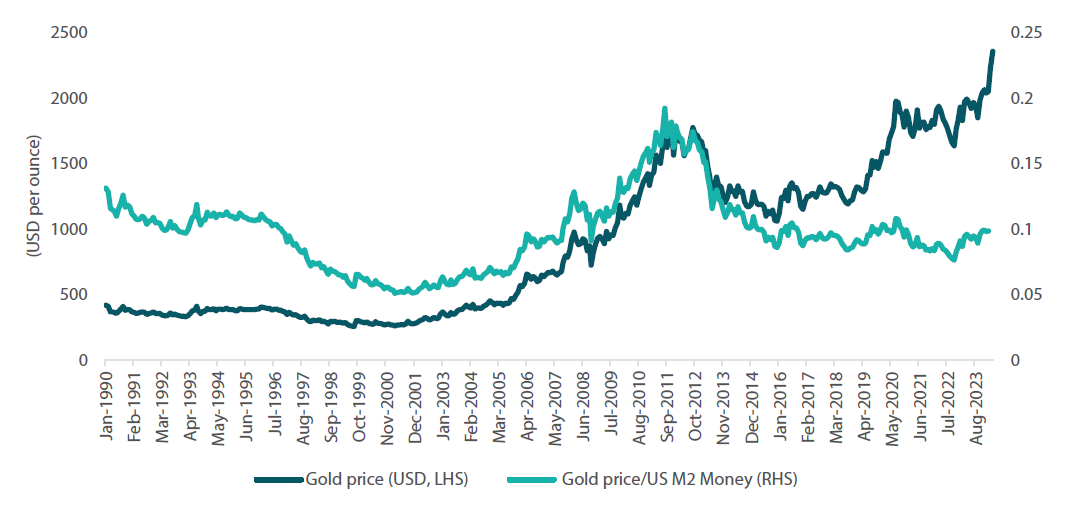
Source: Bloomberg, March 2024
What is even more significant is that over the past two years, as interest rates have surged and the correlation between bonds and equities has increased, the correlation between stocks and gold has remained relatively stable. This suggests that gold has provided more diversification benefits than traditional fixed income assets, offering stability to portfolios in times of turmoil. While forecasting the Fed’s moves can be a challenging task, we believe that gold will continue to provide strong diversification benefits for portfolios. The precious metal provides a hedge against stickier-than-expected inflation and, more importantly, against any government missteps regarding their already precarious finances.
Conviction views on defensive assets
-
Short-dated IG credit: Credit spreads remain at fair levels, but many markets still exhibit inverse yield curves, making longer-dated credit less appealing. Until curves steepen, shorter-dated credit is likely to remain our preference.
Gold remains an attractive hedge: Gold has been resilient in the face of rising real yields and a strong dollar, while proving to be an effective hedge against geopolitical risks and persistent inflation pressures.
Attractive yields in EM: Real yields in this sector are generally very attractive, and we have a preference for quality EM currencies. While certain sections of EM currencies could come under particular pressure against a stronger dollar, we see cause for additional support, especially as volatility in both rates and foreign exchange diminishes.
Process
In-house research to understand the key drivers of return: